Mermaid
Installation and usage of the command-line version of the JavaScript based diagramming and charting tool.
I use Mermaid to create diagrams in my thesis. The command-line usage of this is most convenient for the quick production of smart, pretty diagrams within quarto markdown documents that are not dynamic (in other words, they do not change with every render of the document). To install, according to the documentation:
npm install -g @mermaid-js/mermaid-cli- First hurdle
-
If your system doesn’t have
npm, you need to install it. It is installed withnode.jsand for my M3 Mac development machine, I used the installer package. - Second hurdle
-
The
npm installcommand above runs into permissions difficulty. The quick and dirty solution is to run the command assudobut all you will do is create yourself permissions problems for later. It’s better to havenpminstall global packages in a user directory.
mkdir "${HOME}/.npm-packages"
npm config set prefix "${HOME}/.npm-packages"
Update your PATH by adding this to your shell profile (.zshrc in my case) and reloading your shell:
export PATH="$HOME/.npm-packages/bin:$PATH"
source ~/.zshrc
Now you can run the npm install without problems, and make nice diagrams like this:
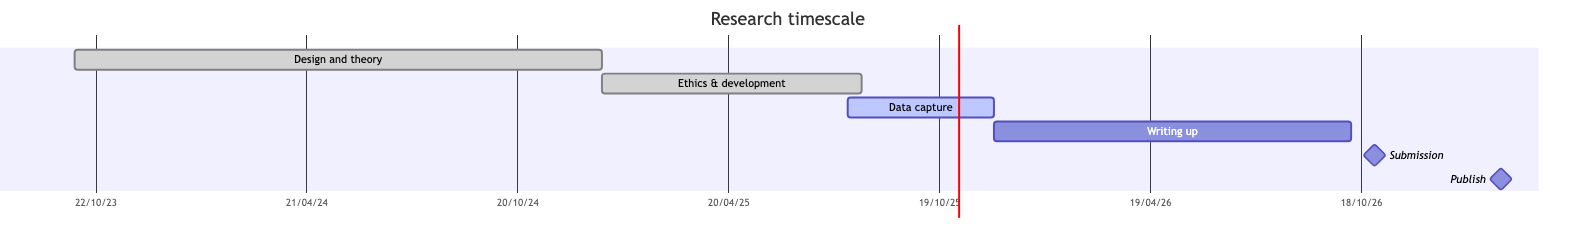
gantt
%% - - - - - - - - - - - - - - - - - - - - - - - - - - - - - - - - -
%% For html rendering use svg output for mermaid diagrams.
%% usage: % mmdc -i example.mmd -o example.svg
%% pdf and docx renders require a large (say, 2048-pixel) width png image to render properly at A4.
%% usage: % mmdc -i example.mmd -o example.png -w 2400
%% - - - - - - - - - - - - - - - - - - - - - - - - - - - - - - - - -
title Research timescale
dateFormat DD-MM-YYYY
axisFormat %d/%m/%y
tickInterval 26week
todayMarker on

Design and theory: done,04-10-2023,65w
Ethics & development: done,PFT1,01-01-2025,32w
Data capture: active,DC,01-08-2025,18w
Writing up: after DC,44w
Submission: milestone,29-10-2026,1d
Publish: milestone,15-02-2027,1d